


Direct comparison, not prophecy
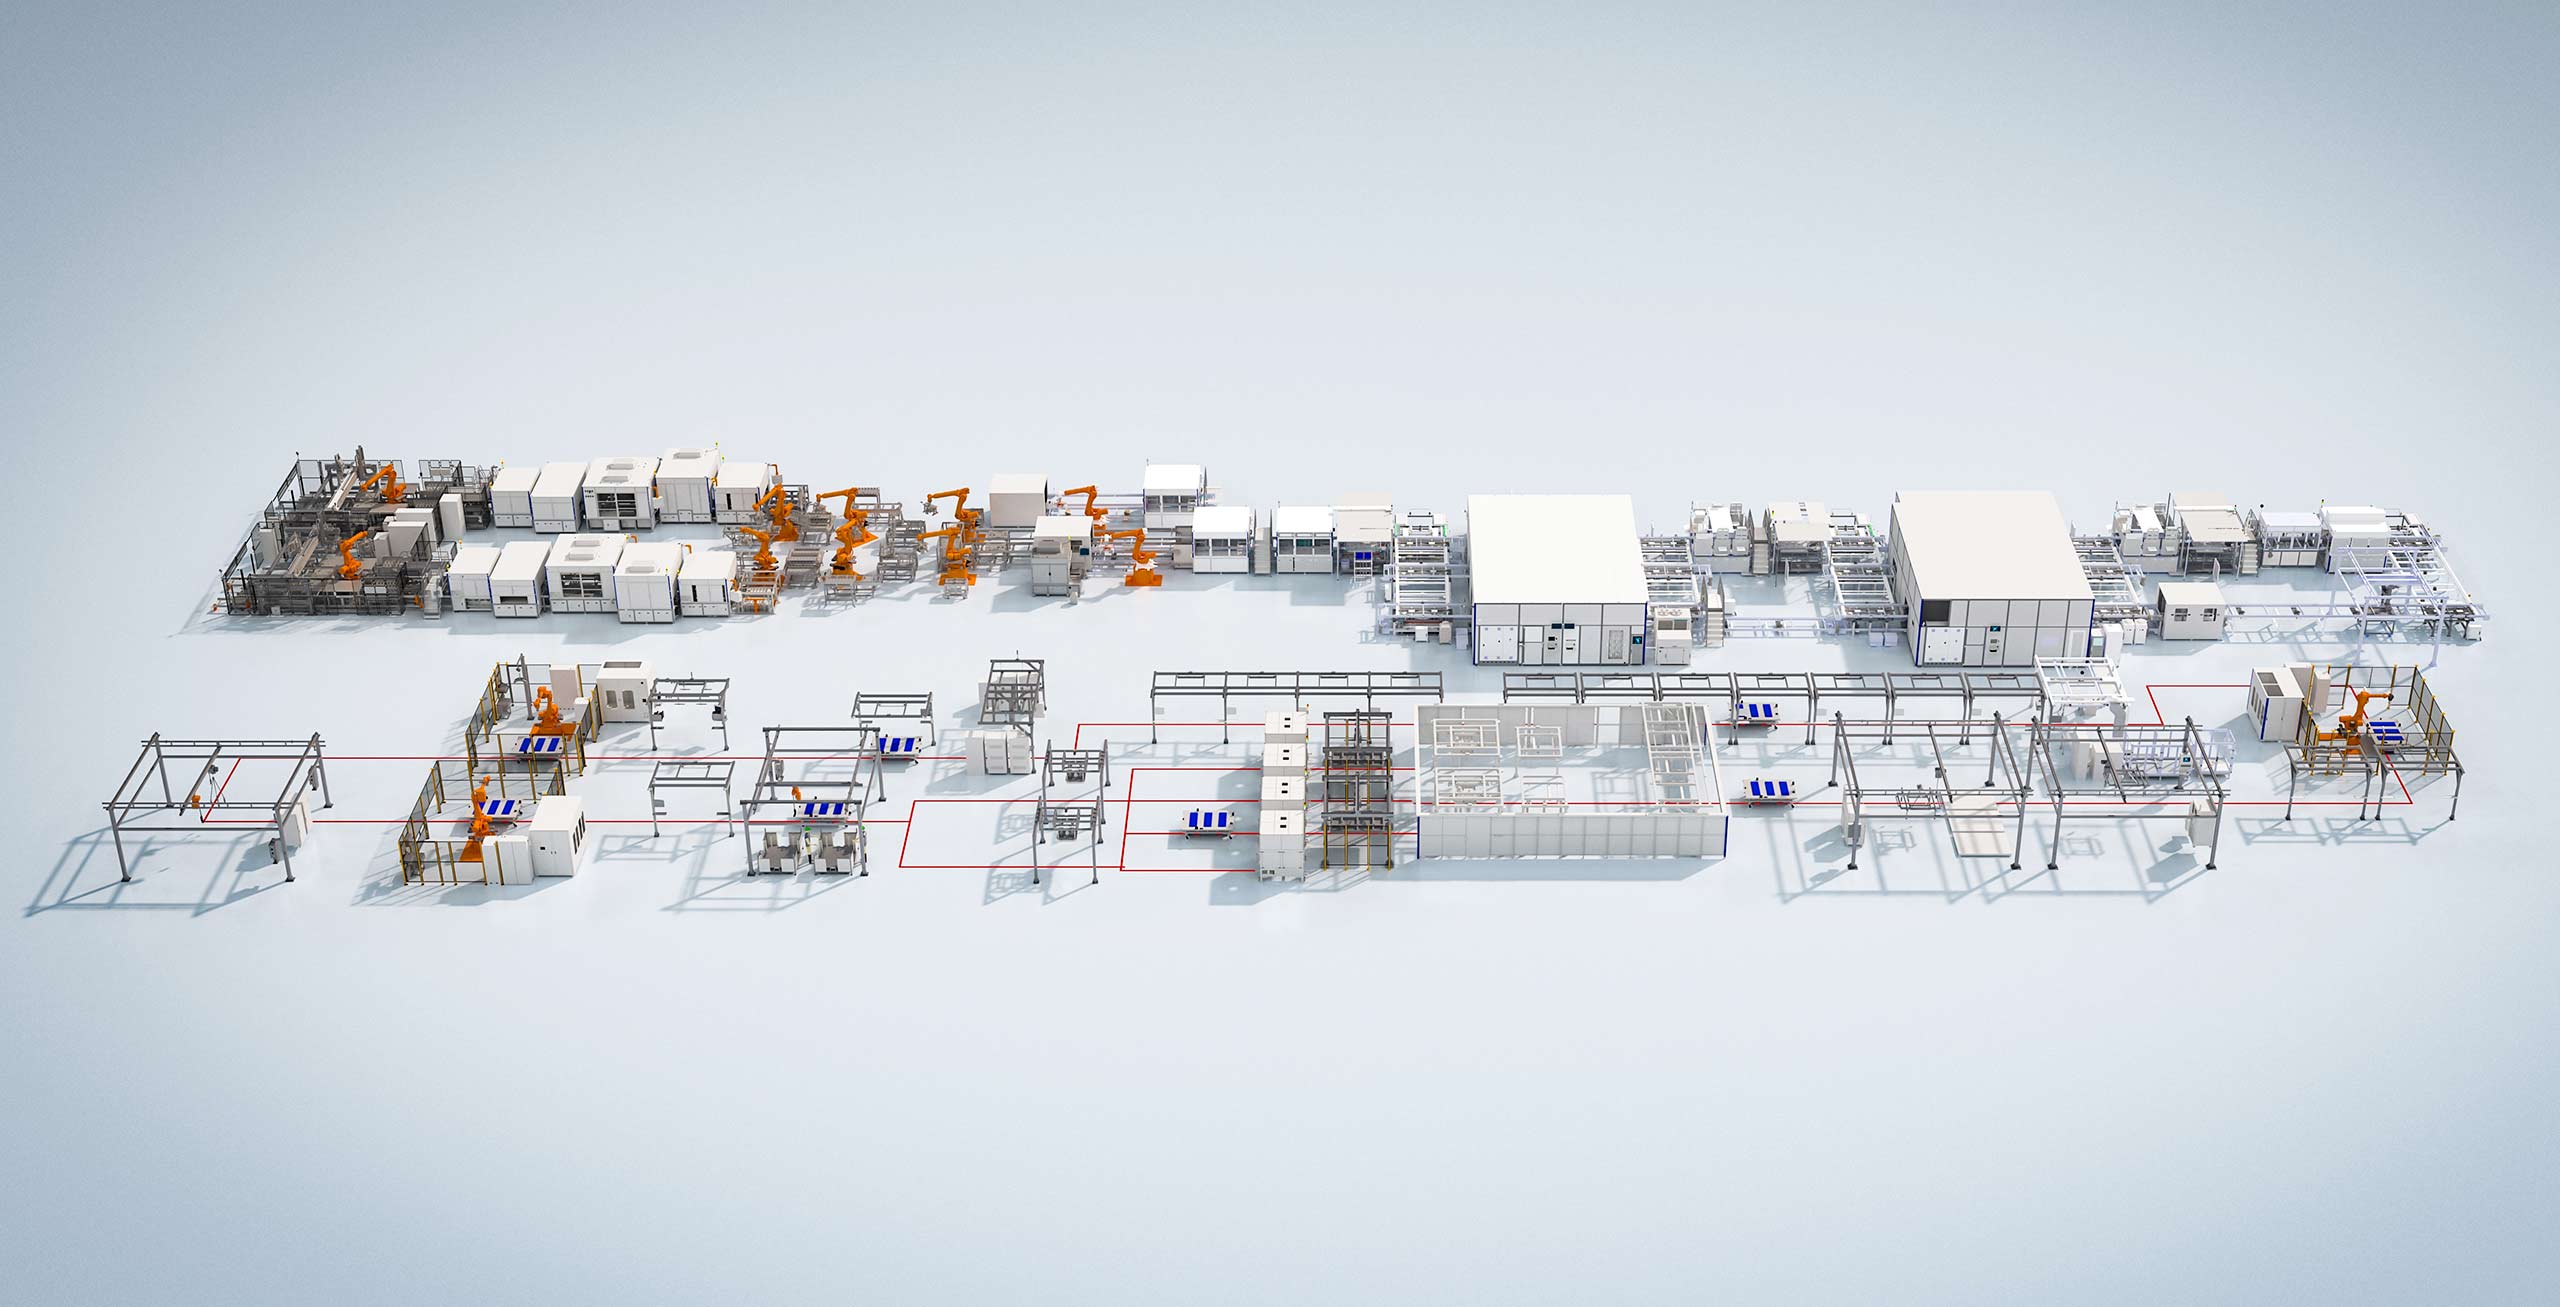
Think of two conveyor lines standing under neon skylights—one paid for up front, the other quietly eating nights of predictive maintenance. Comparative Insight means you measure them side-by-side on the same clock. Start by cataloging the vendors, the integration scope and the expected throughput, and loop in mechanical partners and battery pack assembly suppliers when your system will handle cells or modules; their constraints change pallet sizes, electrical grounding, and cycle cadence. My approach is practical: list what you’ll measure, then run the same scenarios against each candidate system.

Core metrics that govern lifecycle value
– Capital expenditure (CapEx): equipment, installation, and commissioning. – Operating expenditure (OpEx): energy draw per pallet-hour, scheduled maintenance, spare parts. – Throughput reliability: percentage of time you meet target pallets per hour. – Flexibility cost: time and cost to reconfigure lines for a new pallet type. – Safety and compliance burden: required guarding, ESD control, and certification updates. Compare numeric estimates over a common horizon (5–10 years). Treat uptime percentage and mean time to repair (MTTR) as conversion factors to monetary value rather than abstract stats.
How to break down total cost — a practical ledger
– Installation friction: conveyors that require facility reconstruction add hidden CapEx. – Integration software: licensing, custom PLC logic, and SCADA connectors. – Energy profile: measure kW per pallet movement under load, then map to local electricity costs. – Spare inventory: fast-moving spares (motors, sensors) should be stocked; slow-moving ones inflate carrying cost. – Decommissioning and resale: robust conveyors retain resale value; flimsy module designs often end at scrap. Frame each bucket as cash flows. Discount future expenses to present value when you need hard apples-to-apples comparisons.
Scenario comparisons that expose trade-offs
Run three parallel scenarios and compare net value: – Low-CapEx, high-OpEx system — quick purchase, heavier maintenance and longer downtime. Suits seasonal volume with short horizon. – Balanced system — moderate purchase, predictable maintenance contracts, modularity for mixed pallets. Best for mixed-production sites. – High-CapEx, low-OpEx system — premium components, higher throughput guarantee, advanced diagnostics. Ideal where uptime loss costs exceed the price premium. Simulate each scenario with your real throughput numbers and failure rates. Multiply downtime minutes by your line’s cost per minute; your comparative insight comes from that single product of probability and consequence.
Specifics for lithium cell and pack environments
Handling battery modules introduces special comparators. Grounding and ESD measures change conveyor material choices. Fire suppression, thermal monitoring, and segregation of damaged pallets add operational steps. If your line touches cells, reference processes in lithium battery manufacturing to ensure conveyors align with pack assembly cadence and safety zoning. Real-world anchor: designs observed at the Nevada Gigafactory show that routing conveyors to minimize manual transfers reduces thermal exposure events and simplifies containment planning. Factor those reductions into your reliability and safety cost models.
How software and sensors alter lifecycle math
Embedded diagnostics lower MTTR but add recurring license fees. Predictive algorithms can convert failures into scheduled swaps, but they demand clean telemetry and spare pools. Compare two systems by the delta: how many prevented failures per year does the predictive layer realistically buy you? Convert that into avoided downtime cost and see if the license pays back inside your horizon.
Common mistakes that skew comparisons
– Using vendor uptime claims without field validation. – Ignoring the cost of rework when pallet specs change. – Forgetting energy demand spikes during peak cycles. – Treating installation as a single line item rather than phased work that interrupts production. Avoid optimism bias: validate vendor numbers against at least one existing installation or third-party test report.
Quick checklist to run your Comparative Insight session
1) Fix the analysis horizon (years). 2) Capture real throughput, failure history, and local energy tariffs. 3) Build a cash-flow table for CapEx and OpEx buckets. 4) Model downtime cost per minute and apply to MTTR and uptime probabilities. 5) Layer in safety and compliance spend for battery-related handling. 6) Run sensitivity checks on throughput and component lead times. This method turns speculative claims into actionable comparisons.
Final synthesis
The future you’re purchasing is a vector: speed, resilience, and how often human hands must intervene. Compare conveyors by translating uptime, flexibility, and safety into dollars across the same time span; include the battery-specific controls that real facilities require. Experienced teams choose systems where prevented downtime outweighs premium spend, not where sales promises sparkle. Practical implementations and vendor histories matter, and the kind of grounded, comparative judgment that surfaces here is what clients find when they consult FHS.