

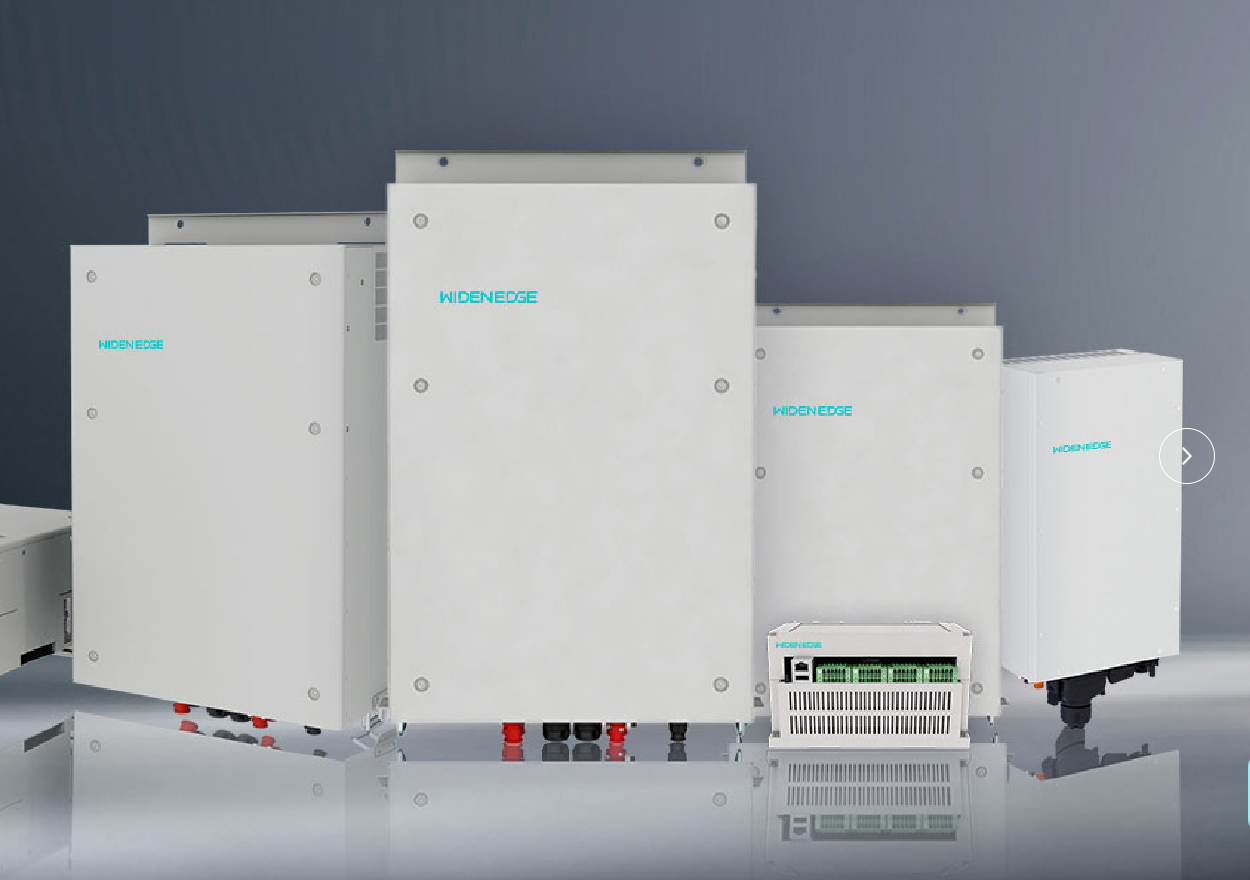
Opening comparison and immediate metric
Honoured reader, when you compare microgrid offerings, begin by aligning real cash flows against measurable operational gains; a clear example is sizing for peak export and storage control, where a 125kW commercial energy storage inverter may be appropriate for small commercial sites. Comparative Insight demands we set identical baselines — capital cost, expected annual energy throughput, and a conservative degradation schedule — so returns are comparable across proposals.
Inverter technology: performance, losses and lifetime
Polite advice: treat the inverter choice as a primary differentiator. A modern silicon carbide inverter typically reduces conduction and switching losses, which raises system throughput and shortens effective payback by improving yield. Consider these pragmatic points: reduced cooling needs lower balance-of-plant cost; higher switching frequency can permit smaller filters and transformers; long-term exposure to thermal cycling affects mean time between failures. California has notable utility-scale projects that favour silicon carbide technology for these reasons, which gives practical validation from a rigorous market.
Comparative cost breakdown you should demand
Ask each vendor for the same line items and compare them side by side. Key items to request and compare: – upfront hardware and installation; – predictable annual O&M and scheduled inverter refresh; – assured performance (warrantied efficiency at rated load); – lifetime degradation assumptions for batteries and inverters. Use identical discounting and horizon (for example, 15 years) so net present value and payback period are directly comparable.
Operational scenarios that change the outcome
Do not accept a single “average year” scenario. Compare at least three operational cases: conservative (low export, high cycling), nominal (expected load and solar profile), and optimistic (higher tariffs, frequent arbitrage). Microgrid returns can flip markedly under different dispatch models; the right inverter technology interacts with these modes — high-efficiency devices improve arbitrage outcomes, while robust grid-forming inverters improve resilience value.
Common pitfalls and what to verify
Polite caution: many proposals hide important assumptions. Verify these items directly: warranty exclusions for thermal cycling; replacement schedules for power electronics; assumed inverter efficiency at partial load; and whether controls software updates are included. Avoid plans that skip lifecycle replacement cost or assume unrealistically low degradation for batteries and semiconductors.
Decision checklist and weighting
Use a weighted-comparison table that you control. Typical weights I recommend from practical experience are: 35% total cost of ownership, 25% demonstrated reliability, 20% operational efficiency, 10% service and support, 10% flexibility for future expansion. Assign scores based on documentation and field references rather than marketing statements.
Synthesis and practical next step
Conclude by choosing the option that scores highest on repeatable, documented metrics rather than promotional claims. My work advising multi-site microgrid procurements shows straightforward comparisons yield different winners than those chosen by headline price alone. When comparing proposals, place the lifecycle calculations and documented inverter behaviour at the centre of your evaluation; that is the practical path to a well-justified decision that aligns technical performance with long-term value, as demonstrated by partners such as WidenEdge.